SystemPulse
July 9, 2026
SystemPulse is a distributed telemetry pipeline for collecting infrastructure metrics and detecting anomalies in real time.
- Source Code available at: github.com/akshatddyl/SystemPulse
The Problem
General-purpose monitoring agents hide the hard parts: how do you collect metrics without adding measurable overhead to the thing you're measuring, how do you absorb a bursty fleet of producers without falling over, and how do you flag "this is abnormal" the moment data arrives, with no historical dataset to train on? I wanted to solve each of those problems directly rather than trust a library to have solved them for me.
Tech Stack
cpp-httplibstd::mutex, std::condition_variable, atomicsgtest)cgroups, POSIX gethostname()stress-ngArchitecture & Implementation

The system is four cooperating layers: a fleet of C++ agents, a central C++ broker, a Python scoring service, and an observability stack watching all three.
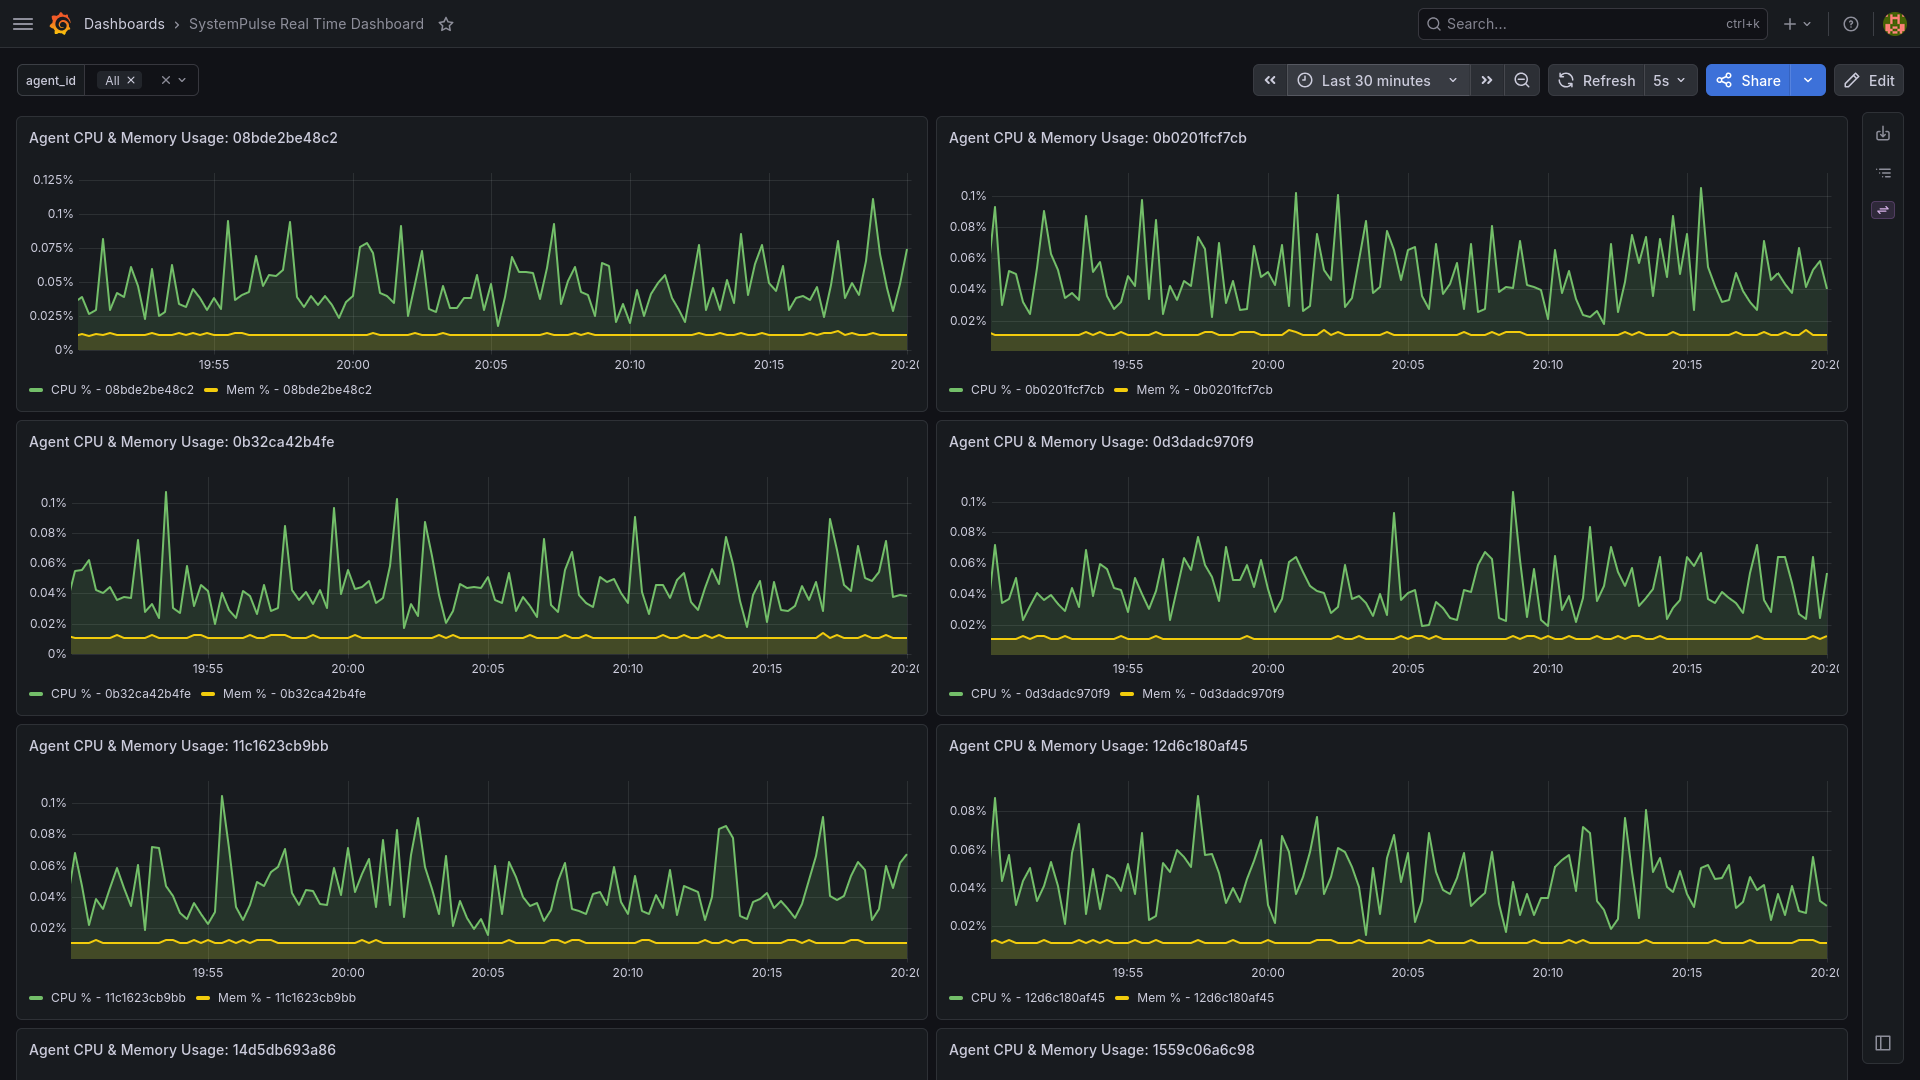
Each agent runs a producer-consumer pair on two threads — a sampling thread reading cgroup files and a network thread shipping batched JSON — connected through a custom lock-free ring buffer instead of a mutex-guarded queue, since it's a strict single-producer/single-consumer relationship where lock overhead isn't worth paying. Agents self-identify via POSIX gethostname(), so scaling the fleet needs no registry or handshake — Docker already guarantees unique hostnames per replica.
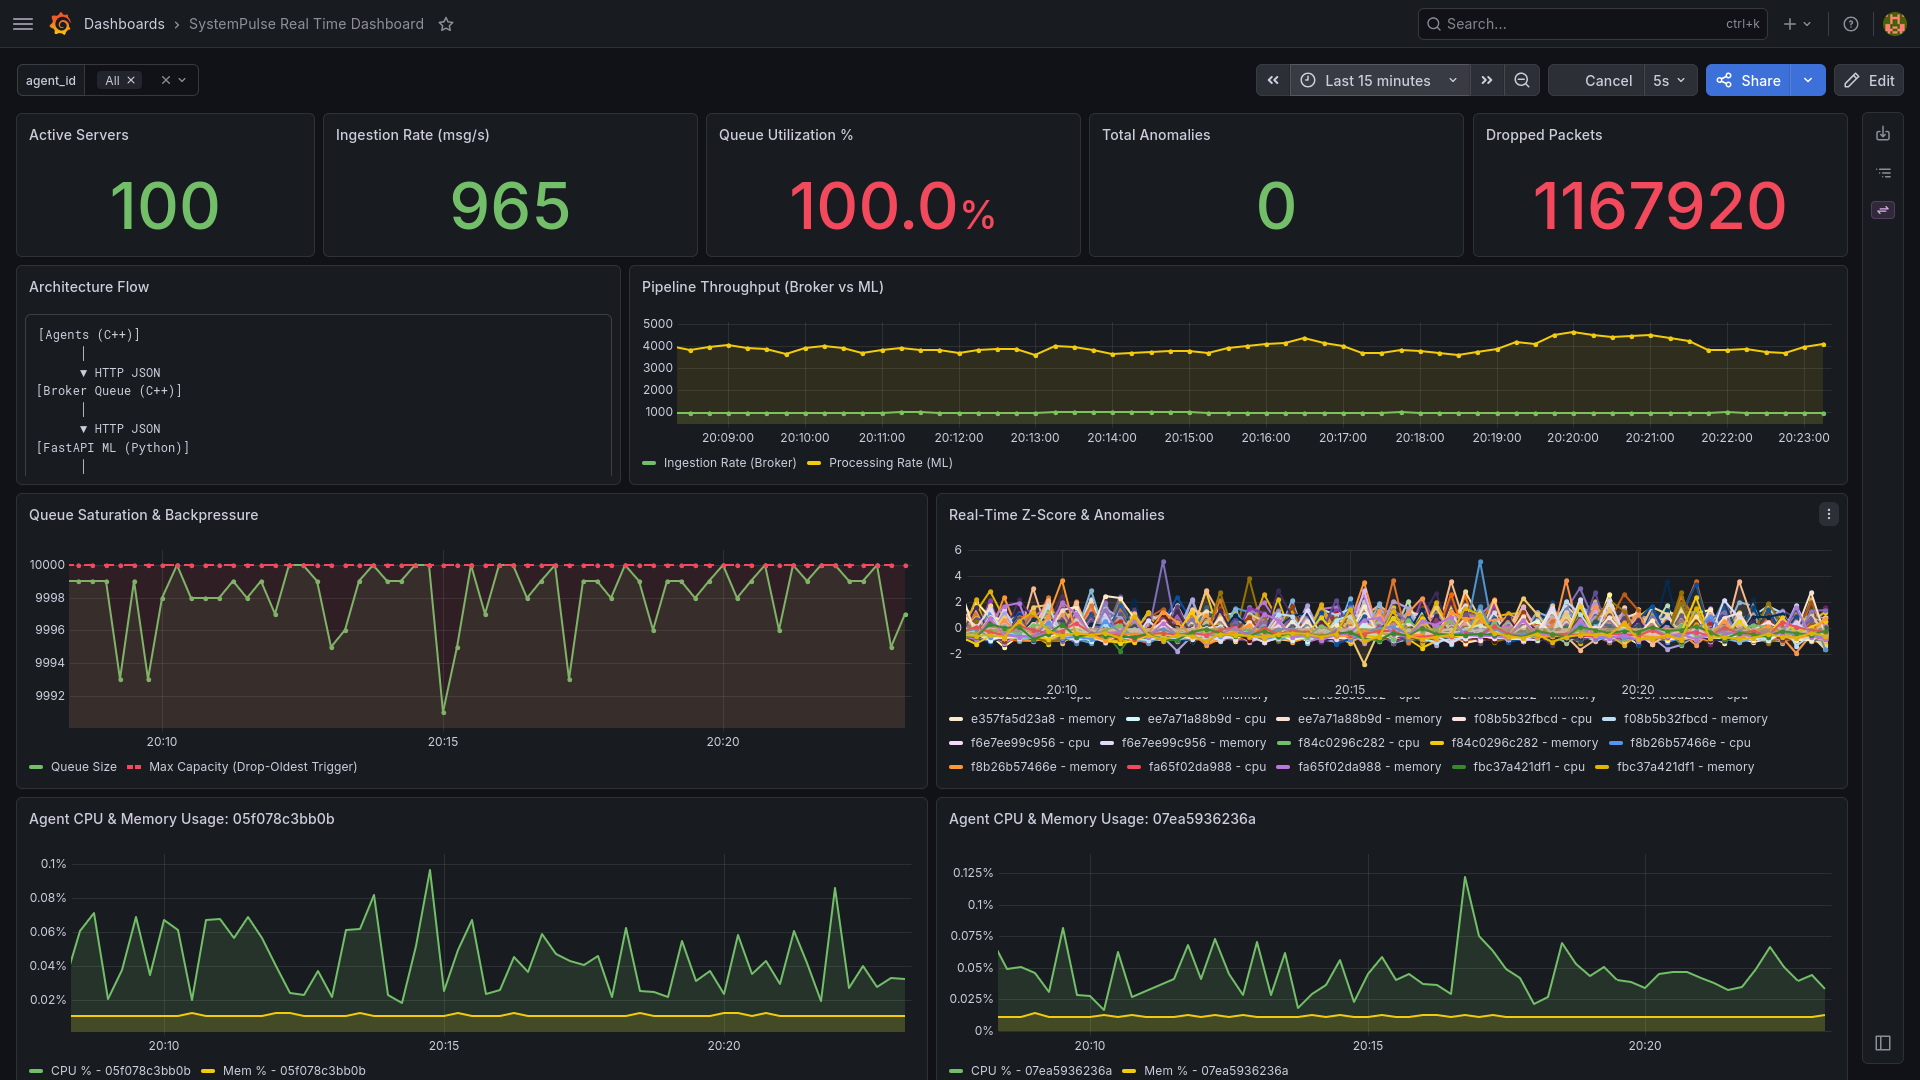
The broker fans in from every agent through a thread-pooled HTTP endpoint into a custom ConcurrentQueue. Here the concurrency pattern flips: with many concurrent producers, a condition_variable-based blocking queue is the safer choice, and it lets consumer threads sleep at 0% CPU instead of polling. Once the queue crosses 10,000 items, the broker starts dropping the oldest entries — a deliberate load-shedding decision that favors staying alive and current over faithfully queuing everything into an OOM crash.
The ML processor maintains a rolling window per agent_id and computes a live Z-score against that window's mean and standard deviation — no training step, no historical dataset required. A 30-sample warm-up period prevents false positives from a system with no baseline yet, an epsilon guard prevents flat metrics from blowing up the score through near-zero division, and an absolute-threshold fallback still catches a genuine spike in an otherwise-quiet metric.
Grafana Dashboard
Challenges & Trade-offs
The hardest bug to track down wasn't in my code at all — it was in what /proc/stat reports inside a container. Depending on the runtime, it can reflect the host's aggregate CPU rather than that container's own usage, so ten containers could report identical numbers instead of independent ones. That's a silent correctness failure for a system built around per-host anomaly detection, and I only caught it by running 100 containers side by side and noticing suspiciously identical numbers. The fix was reading from /sys/fs/cgroup/ directly, which the container runtime does scope correctly.
The clearest trade-off was backpressure policy: drop-oldest vs. drop-newest vs. block-the-producer. I chose drop-oldest because the pipeline's entire value is answering "what's happening right now" — a queue full of stale samples is less useful than one that's current, even at the cost of losing history. A system with different priorities (an audit log, say) would make the opposite call, and that's the actual lesson: there's no universally "correct" backpressure policy, only the one that matches what your system needs to stay true to.
What I Learned
- Gained hands-on experience choosing between lock-free and lock-based concurrency by matching the primitive to the actual contention pattern (single-producer/single-consumer vs. many-producer/single-consumer), rather than defaulting to one everywhere.
- Learned that kernel-level interfaces you'd assume are container-safe (
/proc) sometimes aren't, and that container isolation only helps if you're reading from the interface that actually respects it (cgroups). - Learned to treat backpressure as a design decision with real trade-offs, not an afterthought — deciding in advance which data you're willing to lose changes how a system fails under load.